Chapter 5
Enhancements in the
Reporting System
A major focus of VFP 9 was improving the reporting system. The list of new and improved features is enormous: multiple detail bands, protection of objects in the Report Designer, design-time events, ability to position objects absolutely, more zoom levels, better menus, and a lot more. This chapter explores these enhancements in detail, demonstrates some types of reports you couldn’t do in earlier versions of VFP, and introduces the “Extending the Reporting System” chapters.
One of the biggest changes in VFP 9 is the incredible improvement made in the reporting system. Three aspects of this are an enhanced Report Designer and other design-time improvements, enhanced run-time capabilities including output to HTML and XML, and new engine capabilities such as support for multiple detail bands. We look at each of these areas in this chapter.
Enhanced Report Designer
Microsoft had several goals in mind when working on the Report Designer:
· Protecting developers’ investment in existing reports.
· Using an open architecture so it would be highly customizable.
· Improving the user interface.
· Providing new features: protection, design-time captions, absolute positioning, DataEnvironment handling, and others.
For the first point, the VFP team worked very hard to ensure existing reports would work exactly the same in VFP 9 as they did in earlier versions. In addition, the FRX structure didn’t change (although some previously unused fields are now used in VFP 9 and there’s now support for user-defined fields and user-defined records).
The keys to a more open architecture are a new system variable called _REPORTBUILDER and report events. The Report Designer can now call a VFP application when events occur at design time, such as adding a field or invoking a dialog. This application is specified in _REPORTBUILDER, which by default points to ReportBuilder.APP in the VFP home directory. You can use your own application if you wish by setting _REPORTBUILDER to point to a different application. This topic is discussed in detail in Chapter 6, “Extending the Reporting System at Design Time.”
Let’s discuss the remaining two points.
Improved user interface
One of the first things you notice in the VFP 9 Report
Designer is the greatly improved dialogs. In VFP 8 and earlier, there were many
dialogs related to reporting: properties
dialogs for each type of object and band, a Page Setup dialog for the report,
Data Grouping and Variables dialogs, and so forth. Some of them had rather unusual
interfaces, and some spawned yet other dialogs. You can see an example of the
clunky interface when you
double-click a field object (see Figure
1): that action opens a properties dialog for the field, but the dialog
doesn’t allow you to change all properties of the field (font and color are
missing, for example) and you have to click buttons to open other modal dialogs
to change some properties.
Figure 1. The Report Expression dialog is an example of the Report Designer’s clunky interface in earlier versions of VFP.
In VFP 9, there are only a few dialogs because all the properties for an object are now in one place. The Properties dialog for all object types uses a tabbed interface, so you can edit all possible properties for the object in one dialog without launching additional modal dialogs. Figure 2 shows the Properties dialog for a field.
The new Report Properties dialog, shown in Figure 3, combines the features of the Page Setup, Title/Summary, Data Grouping, Variables, and Set Grid Scale dialogs from earlier versions, plus adds new features as well.
These dialogs aren’t actually part of the product, but are provided by ReportBuilder.APP. That’s right, they’re VFP forms! The source code for ReportBuilder.APP comes with VFP (unzip XSource.ZIP in the Tools\XSource subdirectory of the VFP home directory, and then look in the ReportBuilder folder), so you can customize or subclass the various dialogs and behaviors to suit your needs. If your application provides access to the Report Designer at run-time, be sure to distribute ReportBuilder.APP (or your replacement for it) with the other files you ship.
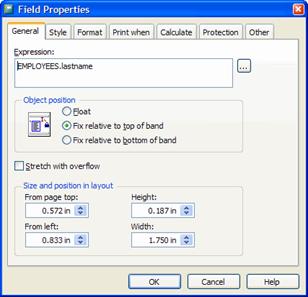
Figure 2. The Properties dialog in VFP 9 uses a tabbed interface to make all properties for an object available in a single dialog.
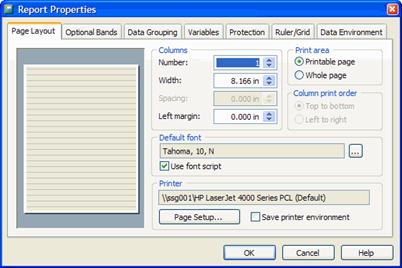
Figure 3. The new Report Properties dialog combines the features of several former dialogs and adds some new features.
Other UI improvements are:
· The Report menu and the shortcut menu for a report are reorganized and have additional items (including Properties, which invokes the Report Properties dialog) to make it easier to work with reports.
· The mouse cursor now changes to provide a visual cue when an object is resizable.
· The Report Designer toolbar includes Page Setup and Font Properties buttons. Also, the View menu includes an item for the Report Designer toolbar. Previously, you had to choose Toolbars from the View menu and turn on the Report Designer toolbar in the resulting dialog.
· The Reports tab of the Tools | Options dialog is reorganized and has three new options: how the Expression Builder should deal with aliases for fields, whether the default run-time behavior is backward-compatible (the equivalent of using the new SET REPORTBEHAVIOR 80 command; see “New reporting syntax” later in this chapter) or object-assisted (the same as SET REPORTBEHAVIOR 90), and whether to use the script for a font (see the “International support” section of this chapter).
Protection
If you allow users to modify reports in the Report Designer in your run-time applications, you may have wished for a way to protect them from themselves. The Report Designer has many features that can get an unsuspecting user in trouble, such as the data environment. If you only want the user to make simple changes, such as moving fields around or adding a company logo, exposing all the features available in the Report Designer is overkill.
VFP 9 has a new keyword for the MODIFY/CREATE REPORT/LABEL commands: PROTECTED. When this keyword is used, you can prevent certain operations. You control which actions a user can take at the object, band, and report levels using the Protection tab of the properties dialogs. For obvious reasons, this tab isn’t available in protected mode.
You can control whether an object can be moved, resized, edited (that is, whether the Properties dialog can be invoked), or deleted. You can even control whether the object can be selected, or if it appears or not. Figure 4 shows the settings available for fields.
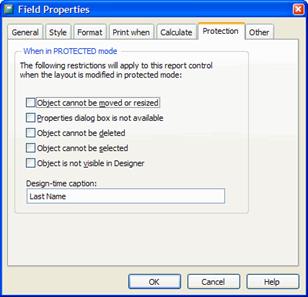
Figure 4. The
Protection tab of the properties dialogs allows you to
control what capabilities the user has in the Report Designer when using
the PROTECTED keyword.
As you see in Figure 5, you can control whether bands can be edited or resized.

Figure 5. You can control the editing or resizing of bands when protection is used.
At the report level, you can control which tabs of the Report Properties dialog and which menu items are available (see Figure 6).
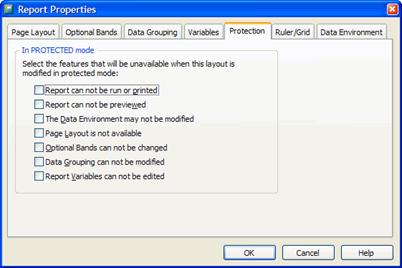
Figure 6. The Protection page of the Report Properties dialog allows you to specify which tabs and menu items are available to the user.
Figure 7 shows what the Report Properties dialog looks like when MODIFY REPORT … PROTECTED is used for a report with the Optional Bands, Data Grouping, and Data Environment tabs turned off.
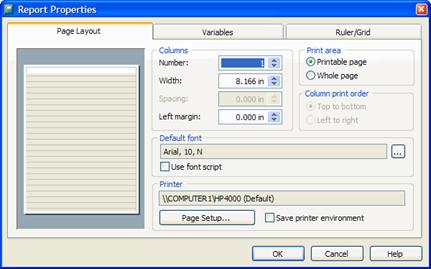
Figure 7. The Report Properties dialog with the Optional Bands, Data Grouping, and Data Environment tabs turned off.
Design-time captions
You may have noticed the Protection tab for a field object has an additional setting: design-time caption. This allows you to indicate what appears in place of the field expression when a report is modified in protected mode.
For example, compare the two Report Designer sessions shown in Figure 8 and Figure 9. Figure 8 used MODIFY REPORT without the PROTECTED keyword.
Figure 8. The expression used to output the page number displays as an expression when PROTECTED isn’t used.
Figure 9 used the PROTECTED keyword. Notice the fields show descriptive names such as Employee Name rather than the actual expression such as ALLTR(Employees.firstname)+" "+ Employees.lastname. This lets you shield your users from seeing the real expressions used for fields and display meaningful descriptive names instead. Note if they bring up the Properties dialog, they will see the real expression because that’s the value they would edit rather than the descriptive name.
Design-time tooltips
In addition to design-time captions, you can also specify design-time tooltips for report objects (all object types, not just fields). Set the desired tooltip text in the Tooltip setting on the Other page of the properties dialog for an object. Figure 10 shows the tooltip for the COMPANYNAME field.
Figure 9. Design-time captions display in place of expressions in protected mode.
Figure 10. TheTooltip setting in the Other page of an object’s properties dialog allows you to specify the tooltip for the object.
Absolute positioning
One thing VFP developers have wanted for a long time is the ability to specify the exact size and position of an object by typing the top, left, height, and width values rather than having to carefully move or resize it one pixel at a time to get it to the correct place and shape. As you can see in Figure 2, the General tab of the object properties dialog now allows you to do just that. However, note that while the size and position values are shown to 1/1000th of an inch, the Report Designer measures things to 1/960th of an inch, so if you enter a value like 0.575, you may find the actual value is 0.572, the closest possible value to what you specified.
Trim mode for character expressions
In earlier versions of VFP, unless you turn on the Stretch with overflow setting, the value of a character expression is truncated if it’s too long for the field. In VFP 9, you can specify how the value should appear. The Trim mode for character expressions setting on the Format page of the Field Properties dialog controls this. The choices are:
· Default trimming: an ellipsis is added to the end of the text indicating there’s more data that can’t be seen. Notice in Figure 11 that several company names have an ellipsis at the end.
Figure 11. One choice in the Trim mode for character expressions setting displays an ellipsis to indicate a value is truncated.
· Trim to nearest character: this cuts off the text at the last character that fits.
· Trim to nearest word: this cuts off the text at the last whole word, similar to the truncation used in earlier versions of VFP.
· Trim to nearest character, append ellipsis: like Trim to nearest character, but adds an ellipsis.
· Trim to nearest word, append ellipsis: same as Default trimming.
· Filespec, show inner path as ellipsis: this has the same effect as the DISPLAYPATH() function; characters at the start and end of the expression appear but middle characters are replaced by an ellipsis.
Note that these settings are ignored unless you run the report in object-assisted mode; see “New reporting syntax” later in this chapter for information on that mode.
Data grouping enhancements
There are three improvements in data grouping in VFP 9.
The first is where VFP places group headers when the report has multiple columns printed left to right rather than top to bottom. Figure 12 shows that in earlier versions, the report engine places a group header in line with the detail band; it takes up the first column and the detail starts in the second column. This first position is reserved for the group header band even if you size the height of the band to zero; in that case, the first column is blank. It’s also a fixed height—that of the detail band—so group header objects may overlap the second row of detail objects if the group header band is taller than the detail band.
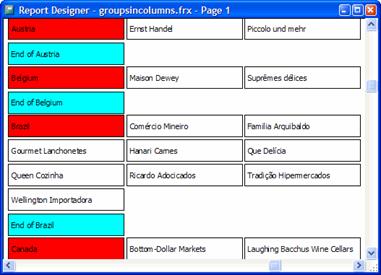
Figure 12. The group header band is placed in line with the detail band in earlier versions of VFP.
As you can see in Figure 13, VFP 9 places group header objects on their own row. This row is the height of the group header band, not the detail band, so group header objects don’t overlap detail objects nor is any space taken up if the group header is sized to zero.
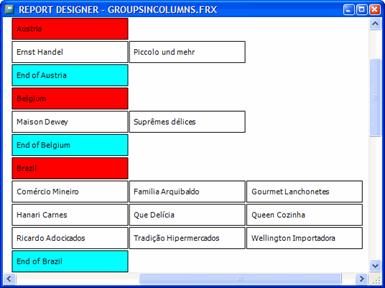
Figure 13. The group header band prints on its own row in VFP 9.
(The authors wish to thank Cathy Pountney for providing this example.)
The second enhancement also pertains to reports with multiple columns printed left to right. Although the design surface only appears to be as wide as a column in the Report Designer, you can actually place objects in group header and footer bands across the page so they span multiple columns. Figure 14 shows what the GroupsInColumns2 report looks like in the Report Designer and Figure 15 shows its appearance when previewed.
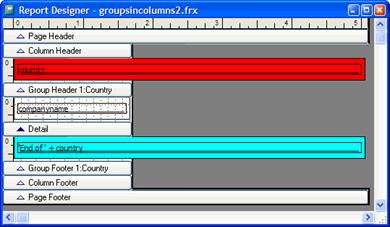
Figure 14. Although it looks odd in the Report Designer, you can put objects in group header and footer bands across the page when a report has multiple columns printed left to right.
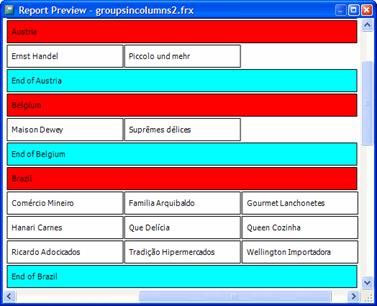
Figure 15.
The objects in the group and footer header bands span all columns of
the report.
The final improvement is that you can now create up to 74 data groups in VFP 9. While the report engine supported that many groups in earlier versions, you were limited to 20 data groups in the Data Grouping dialog.
![]()
The Developer Download files for this chapter, available at www.hentzenwerke.com, include GroupsInColumns.FRX and GroupsInColumns2.FRX.
DataEnvironment handling
There are two changes dealing with the DataEnvironment of a report: you can now save the DataEnvironment as a class and you can load the DataEnvironment from another report or from a DataEnvironment class.
VFP 8 added the ability to visually subclass a DataEnvironment. In VFP 9, to save the DataEnvironment of a report as a class, open the DataEnvironment window and choose Save As Class from the File menu.
To load the DataEnvironment of a report from another report or from a DataEnvironment class, choose Load Data Environment from the Report menu or bring up the Report Properties dialog and choose the Data Environment page. Copying the DataEnvironment from another report is pretty straightforward; it simply copies the DataEnvironment-related records from the specified FRX to the current one. This means, of course, changes made later in the other report aren’t reflected in this report.
Linking the DataEnvironment to a DataEnvironment class, on the other hand, may not do quite what you expect. Unlike a form or form class, an FRX doesn’t support referencing a DataEnvironment class. Instead, the various members of the DataEnvironment are loaded into records in the FRX. For example, if there are two cursors and a relation in the DataEnvironment class, records for these objects are added to the FRX. Code in the DataEnvironment class is handled in a very interesting way: code is inserted into various methods of the DataEnvironment, Cursor, and Relation records, and the BeforeOpenTables method has code that instantiates the specified DataEnvironment class and binds events of the DataEnvironment in the report to the appropriate events in the DataEnvironment class. That way, the code in the DataEnvironment class fires as you’d expect. It’s just wired up differently than a form or form class.
International support
The Windows Font dialog includes a Script setting that allows a user to select the desired language script. Values include Western, Cyrillic, Japanese, Hebrew, and Arabic. VFP objects support this with their FontCharSet property. Unfortunately, earlier versions of VFP didn’t store the selected script in a report, either for report objects or for the default font of the report. In VFP 9, this value is now saved so full support is provided. The Use font script setting in the Style page of the Field Properties and Label Properties dialogs and the Page Layout page of the Report Properties dialog allows you to control this.
In addition, the VFP team ensured that alignment works better than before in both left-to-right and right-to-left languages.
Other new features
The FRX file has had a USER memo field for a long time. This field wasn’t used by the VFP Report Designer and was intended to hold user-defined information. (A bug in earlier versions of VFP wiped out the contents of this field whenever a report was saved. This is fixed in VFP 9.) However, this field wasn’t exposed in any of the Report Designer’s dialogs. In VFP 9, this is now available in the Other page of the properties dialog for objects (see Figure 16).
The Other page also provides access to “run-time extensions.” This is actually XML stored in the STYLE memo field for objects in the FRX. Here’s an example:
<VFPData><reportdata name="" type="R" script="" execute="test" execwhen="test2" class="" classlib="" declass="" declasslib=""/></VFPData>
The XML schema is quite open; you can add your own attributes and remove attributes you don’t need.
Neither the Report Designer nor the run-time reporting tools that come in the VFP box make any use of this XML, but your own enhancements to these tools certainly could. (See Chapter 6, “Extending the Reporting System at Design Time,” and Chapter 7, “Extending the Reporting System at Run Time,” for information on enhancements you can make.) Click the Edit Settings button to bring up a dialog for entering some of the information stored in the XML for the current object. This dialog only allows you to edit the execute and execwhen attributes of the first node in the XML. However, you can replace the dialog with your own if you need more functionality; see Chapter 7, “Extending the Reporting System at Run Time,” for details.
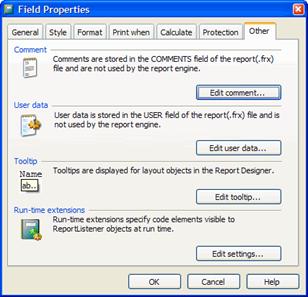
Figure 16.
The Other page of the properties dialog for objects allows access
to several new features, including the USER memo, design-time tooltips, and
run-time extensions.
The Format page of the Field Properties dialog has what appears to be a new feature: the Template characters setting. This option, which is only available for character fields, has Overlay and Interleave choices. However, this is really not a new feature, but instead determines whether “@R” is added to the picture. The “@R” does not display, but is stored when Interleave is selected.
The Expression Builder dialog no longer shows tables from the DataEnvironment, only the cursors currently open. This gives you greater control over what fields the user can select in this dialog.
Multiple detail bands
Crystal Reports is one of the most popular reporting
tools in the world. One of the main reasons many VFP developers, who already
have a report writer built into the product, use
For example, suppose you have a customers table, an invoices
table, and a credit notes table. You may want to show customers, their
invoices, and credit notes on a report. The complication here is that the
report has three tables it needs to go through, and while invoices and credit
notes are related to customers, they aren’t related to each other. The way you
resolve this in
Unfortunately, until now, there wasn’t a good way to do this in VFP. A common workaround is to create a cursor combining invoices and credit notes, with a “record type” field distinguishing which records come from which table. The report includes fields from both types of records in the detail band with Print When expressions on the fields so only certain fields print for each type of record. This makes for a very ugly report to maintain!
Fortunately, VFP 9 solves this problem nicely with a new feature: multiple detail bands.
Record processing
Before looking at multiple detail bands, let’s discuss how VFP moves through records in a report. A report has a single “driving” cursor. VFP moves through this cursor in a single pass; that is, the cursor is processed only once. The processing of these records is paused by group breaks; the report engine takes whatever action is specified (for example, printing a group footer for the former group and a group header for the new one), and then continues processing the cursor. The set of records processed without interruption is referred to as a “detail scope.” If there are any groups for the report, the detail scope is the records inside the innermost group. If not, it is the entire report scope.
In VFP 9, there can now be multiple detail scopes (up to 20). The records for a particular detail scope can be from related records in child tables or from the driving alias, which means it can be processed multiple times. The Report Designer presents these multiple detail scopes as multiple detail bands. An important thing to note is detail scopes are consecutive, not nested like group breaks.
Calculated fields and report variables can now be scoped to a particular detail band. Interestingly, variables retain their values until the band they’re scoped to is processed again. This means you can use these variables in later detail bands if necessary. The Variables page of the Report Properties dialog now uses “reset based on” rather than “reset at” as the prompt for a variable’s scope to reinforce this idea.
Creating multiple detail bands
Every report has at least one detail band. To create additional detail bands, choose Optional Bands from the Report menu, the report shortcut menu, or bring up the Report Properties dialog and choose the Optional Bands page (see Figure 17). The Add button adds a new detail band and the Remove button removes the selected detail band. You can rearrange the order of the bands in the list.
In the Properties dialog for a detail band, you can specify whether the band has header and footer bands and indicate the target alias expression for the detail scope (see Figure 18). Ordinarily, the report engine processes a single record in the driving cursor before moving to the next detail band. However, if you specify a child cursor as the target alias, the report engine will process all child records of the current driving cursor record before moving to the next band. Note: you enter the target alias as an expression; to use a hard-coded name, surround it with quotes. Because this is an expression, you could enter the name of a variable that contains the target alias or even call a user-defined function (UDF). This may lead to some very interesting types of reports!
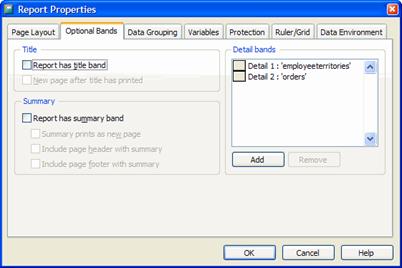
Figure 17. You can define multiple detail bands in the Optional Bands page of the Report Properties dialog.
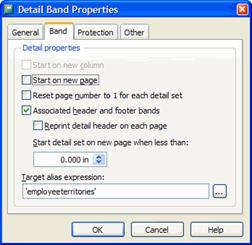
Figure 18. Use the Detail Band Properties dialog to specify whether the selected band has header and footer bands and provide the target alias.
The target alias expression can evaluate to one of three values:
· An empty string means use the driving alias.
· The alias of a child table tells the report engine to process all the child records of the current driving cursor record before moving to the next band. This requires a relationship to exist between the driving alias and the child table, either using the SET RELATION command or by creating a relationship in the DataEnvironment of the report.
· The driving alias, which is valid in the first detail band only, tells the report engine to process all driving alias records until it encounters a group break or the end of the report scope before moving to the next detail band.
Detail bands now also have some of the same options as group bands: starting on a new column or page, resetting the page number to 1 for each detail set, reprinting the detail header on each page, and starting the detail set on a new page when the amount of space remaining on the page is less than a desired value.
Let’s look at a couple of examples of multiple detail band reports.
Example 1: Multiple children
The first example, EmployeesMD.FRX, uses the Employees, EmployeeTerritories, and Orders tables from the Northwind sample database that comes with VFP (in the Samples\Northwind subdirectory of the VFP home directory). EmployeeTerritories and Orders are both child tables of Employees, related on the EmployeeID field in each table. We want a report showing each employee, the territories he or she represents, and the orders taken by this employee.
The DataEnvironment for this report is set up as shown in Figure 19. The relationships between Employees and its child tables are one-to-many (the OneToMany property for the Relation objects is .T.) so all child records for a given Employees record will process in a detail band. Note this isn’t strictly necessary; if you neglect to set OneToMany, the report engine automatically uses SET SKIP to do the same thing.
Figure 19. The DataEnvironment for EmployeesMD.FRX defines EmployeeTerritories and Orders as children of Employees.
The report has a group expression on Employees.EmployeeID and
the desired fields
from the Employees table appear in the group header band. There are two detail
bands, one with a target alias of EmployeeTerritories and the other with a
target alias of Orders; the appropriate fields appear in each band. Figure 20 shows what the report looks
like in the Report Designer. Figure 21
shows the result when the report is run.
Figure 20. EmployeesMD.FRX has two detail bands, one for fields of EmployeeTerritories and one for Orders.
Figure 21.
Running EmployeesMD.FRX shows how a multiple detail band
report works.
![]()
The Developer Download files for this chapter, available at www.hentzenwerke.com, include EmployeesMD.FRX. Because of path differences, you will likely have to locate Northwind.DBC (it’s in the Samples\Northwind subdirectory of the VFP home directory) when you open this report.
Example 2: Pre-calculation of totals
The next example is similar to the first one, but doesn’t show two child tables; instead, it runs through the same child twice. The idea here is we want to calculate the number and total amount of the orders for each employee, but we want to show these calculations before displaying the actual orders. In addition, we want to show the amount of each invoice as a percentage of the total amount, meaning we have to pre-calculate the total.
In previous versions of VFP, this would require doing the calculations prior to running the report, and using the results of those calculations in the report. In VFP 9, this simply means having one detail band performing the calculations and another displaying the results. In the case of this example, EmployeesMD2.FRX, both detail bands have the Orders table as the target alias. Figure 22 shows what the report looks like in the Report Designer; notice there are no objects in the Detail 1 band.
Figure 22. EmployeesMD2.FRX uses the Detail 1 band to pre-calculate totals used in the rest of the report.
The DataEnvironment for this report is set up as shown in Figure 23. The relationship between Employees and Orders is one-to-many so all orders for a given employee will process in both detail bands. The Customers table is related to the Orders table so the customer name for an order is included in the report. Order_Subtotals is a view that calculates the subtotal for each order into its Subtotal field. We want Order_Subtotals to be a child table of Orders, but because you can’t define indexes or relationships for views in a database, we do it in code in the OpenTables method of the DataEnvironment:
local lnSelect
dodefault()
if empty(cdx(1, 'Order_Subtotals'))
lnSelect = select()
select Order_Subtotals
index on OrderID tag OrderID
select Orders
set relation to OrderID into Order_Subtotals additive
select (lnSelect)
endif empty(cdx(1, 'Order_Subtotals'))
nodefault
Figure 23. The DataEnvironment for EmployeesMD2.FRX sets up the relationships needed for this report.
There are two variables defined: OrdersCount, which is a “count” variable reset based on Detail 1, and OrdersTotal, which sums Order_Subtotals.Subtotal and is also reset based on Detail 1. So, all the Detail 1 band is used for is to process all order records for the current employee and calculate the proper values for the OrdersCount and OrdersTotal variables. Then, the order records are processed a second time in Detail 2. The number of orders and total amount is shown in the header for Detail 2 and the orders and the percentage each is of the total amount is shown in the detail band.
Figure 24 shows what the report looks like when it’s run.
Figure 24. Showing totals before the details and computing percentages of a total are easy using multiple detail bands.
![]()
The Developer Download files for this chapter, available at www.hentzenwerke.com, include
EmployeesMD2.FRX. Because of
path differences, you will likely have to locate Northwind.DBC (it’s in the
Samples\Northwind subdirectory of the VFP home directory) when you
open this report.
Enhanced run-time capabilities
The VFP development team had several goals in mind when they worked on the run-time improvements, including:
· Handling more types of report output than just printing and previewing.
· Using GDI+ for report output. This provides many significant improvements, such as more accurate rendering, smooth scaling up and down of images and fonts, and additional capabilities such as text rotation.
· Providing a more flexible and extensible reporting system.
Before VFP 9, the report engine was monolithic: it handled everything–data handling, object positioning, rendering, previewing, and printing. Also, with a few exceptions (UDFs in field, grouping, and variable expressions, expressions for OnEntry and OnExit of bands, and so forth), you couldn’t interact with it during a report run.
The new reporting engine in VFP 9 splits responsibility for reporting between the report engine, which now just deals with data handling and object positioning, and a new object known as a report listener, which handles rendering and output. Because report listeners are classes, you can interact with the reporting process in ways you could only dream of before.
VFP 9 includes both the old report engine and the new one, so you can run reports under either engine as you see fit. However, once you see the benefits of the new report engine, you won’t want to go back to old-style reporting unless it’s absolutely necessary.
New reporting syntax
VFP 9 supports running reports using the old report engine; simply use the REPORT command as you did before (although, as you will see in a moment, you can use a new command to override the behavior of REPORT). To get new-style reporting behavior, use the new OBJECT clause of the REPORT command. OBJECT supports two ways of using it: by specifying a report listener and specifying a report type. Microsoft refers to this as “object-assisted” reporting.
A report listener is an object providing new-style reporting behavior. Report listeners are based on a new base class in VFP 9, ReportListener. To tell VFP to use a specific listener for a report, instantiate the listener class, and then specify the object’s name in the OBJECT clause of the REPORT command. Here’s an example:
loListener = createobject('MyReportListener')
report form MyReport object loListener
If you’d rather not instantiate a listener manually, you can have VFP do it for you automatically by specifying a report type:
report form MyReport object type 1
The defined types are 0 for outputting to a printer, 1 for previewing, 4 for XML output, and 5 for HTML output. You can also define your own types.
When you run a report this way, the application specified in the new _REPORTOUTPUT system variable (by default, ReportOutput.APP in the VFP home directory) is called to figure out which listener class to instantiate for the specified type.
You’re probably thinking “But I have tons of reports in my application. Do I have to find and modify every REPORT command in the entire application?” Fortunately, there’s an easier way: SET REPORTBEHAVIOR 90 turns on object-assisted reporting by default. This means the REPORT command behaves as if you specified OBJECT TYPE 0 when you use the TO PRINT clause or OBJECT TYPE 1 when you use the PREVIEW clause. SET REPORTBEHAVIOR 80 reverts to VFP 8 and earlier behavior. If most or all of the reports in your application work just fine in object-assisted mode, use SET REPORTBEHAVIOR 90 at application startup. Because of rendering differences between new and old-style reporting, you may need to tweak some reports to work properly with new-style reporting, so either tweak them or use SET REPORTBEHAVIOR 80 to run just those reports. See the “Changes in Functionality for the Current Release” topic under the “What’s New in Visual FoxPro” heading in the VFP help for details on the differences in rendering between backward-compatible mode and object-assisted mode.
ReportOutput.APP is primarily an object factory; it instantiates the appropriate listener for a report. It also includes some listeners that provide XML and HTML output. However, because it’s just a VFP application, you can substitute your own application for it by setting _REPORTOUTPUT accordingly. Be sure to distribute ReportOutput.APP (or your replacement for it) to your users so your applications use object-assisted reporting.
ReportOutput.APP and report listeners are discussed in detail in Chapter 7, “Extending the Reporting System at Run Time.”
Let’s take a look at some specifics of the run-time improvements.
New preview window
At first glance, the VFP 9 preview window shown in Figure 25 may not look much different than it does in earlier versions. However, take a close look at the toolbar.

Figure 25. The preview window in VFP 9 has more features, plus it’s a VFP form, so you have complete control over its appearance.
Notice there are new buttons allowing you to specify the number of pages displayed at a time. Figure 26 shows what four pages at a time looks like (you must reduce the scale of the report to 25% to see all four pages at once).
Also notice you can now scale the report above 100%: 200, 300, and 500% are supported. This works in both the new and old preview windows. However, the old preview window will display rather jagged text at higher scales while the new preview window will show smooth text; this illustrates one of the benefits of GDI+ over GDI. Another new feature is a shortcut menu that duplicates the functions in the toolbar, plus allows you to hide or show the toolbar.

Figure 26. You can display one, two, or four pages at a time in the preview window.
Finally, try the following:
_screen.Forms[2].Caption = 'This is my report'
That’s right—the preview window is a VFP form rather than a native window. That means you have full control over its appearance, something painful to do in previous versions. This preview window is used when you run a report in object-assisted mode; otherwise, the same window available in earlier versions of VFP is used.
A new system variable, _REPORTPREVIEW, specifies the name of a VFP application that provides the preview window for reports. By default, this variable points to ReportPreview.APP in the VFP home directory, but you can substitute your own application if you wish to. You can specify the form used for output in other ways as well; however, a discussion of how to do that is beyond the scope of this chapter. As with the other new VFP modules, be sure to distribute ReportPreview.APP or your replacement for it if your applications use the new preview window.
Progress feedback
When a long report runs, you may wish there was some way to show the user that something is happening. The UpdateListener class built into ReportOutput.APP does this; it displays the progress as the report is processed, and also gives the ability to cancel (see Figure 27). You can disable this feedback if you want to, or provide your own using a report listener. An example of this is shown in Chapter 7, “Extending the Reporting System at Run Time.”
![]()
Figure 27. The UpdateListener class displays the progress of a report and gives the user the ability to cancel.
HTML and XML output
Although you’ve been able to output a report to HTML for several versions using GenHTML.PRG, the results, frankly, aren’t very good. Fortunately, in VFP 9, you can create high-quality HTML output, as well as XML output, using some listeners built into ReportOutput.APP.
Listener type 5 specifies HTML output and type 4 is for XML output, so you can use the following command to output to HTML:
report form MyReport object type 5
However, this doesn’t give you any control over the name of the file to create or other settings. Instead, call ReportOutput.APP for a reference to the desired listener, set some properties, and then tell the REPORT command to use that listener.
The following code (taken from HTMLOutput.PRG) creates an HTML file called MyReport.HTML from the first six pages of the EmployeesMD report. When you specify type 5, ReportOutput.APP uses its built-in HTMLListener class to provide output.
loListener = .NULL.
do (_reportoutput) with 5, loListener
loListener.TargetFileName = 'MyReport.html'
loListener.QuietMode = .T.
report form EmployeesMD object loListener range 1, 6
Figure 28 shows what the output looks like.
The following code (taken from XMLOutput.PRG) creates an XML file called MyReport.XML from the first six pages of the EmployeesMD report, containing only the data. In this case, the XMLListener class (type 4) in ReportOutput.APP is used.
loListener = .NULL.
do (_reportoutput) with 4, loListener
loListener.TargetFileName = 'MyReport.xml'
loListener.QuietMode = .T.
loListener.XMLMode = 0 &&
0 = data only, 1 = layout only, 2 = both
report form EmployeesMD object loListener range 1, 6
Figure 29 shows the results.

Figure 28. VFP 9 provides high-quality HTML output from reports.

Figure 29. Using the XMLListener class, you can generate XML from a report that includes only the data, only the report layout, or both.
![]()
The Developer Download files for this chapter, available at www.hentzenwerke.com, include HTMLOutput.PRG and XMLOutput.PRG.
HTML output actually uses the XML listener to produce XML, and then uses XSLT to produce the HTML end-result.
Both of these listener classes have additional properties you can use to further control the output. See the VFP documentation for details.
Graphic file output
With a report listener, you can also output to a graphic file. VFP 9 supports EMF, TIFF (single and multi-page), JPG, BMP, PNG, and GIF. Third-party listeners may support other files types as well.
Here’s some simple code, taken from GraphicOutput.PRG, that outputs a single page of the EmployeesMD report to a GIF file. Figure 30 shows the resulting GIF file.
loListener = createobject('ReportListener')
loListener.ListenerType = 3
report form EmployeesMD object loListener range 1, 1
loListener.OutputPage(1, 'MyReport.gif', 104) && 104 = GIF

Figure 30. You can output a report to a graphics file, such as this GIF image.
See Chapter 7, “Extending the Reporting System at Run Time,” for details on this topic.
![]()
The Developer Download files for this chapter, available at www.hentzenwerke.com, include GraphicOutput.PRG.
What about PDF?
Of course, the question you’re asking now is “What about PDF output?” VFP 9 does not include PDF output in the box. However, there are several ways you can get PDF output from VFP (in both 9 and previous versions):
· Use Adobe Acrobat or another PDF writer such as Print2PDF.
· Use a VFP-specific third-party tool supporting PDF output, such as Mind’s Eye Report Engine, XFRX, or FRX2Any. Most of the creators of these tools are working on or have finished VFP 9 versions of their tools.
· Output to a PostScript file by printing to an appropriate driver, and then use the freeware GhostScript utility to convert it to a PDF file.
Other printing enhancements
There are a number of other general printing enhancements in VFP 9.
SYS(1037), which displays the Page Setup dialog, has some new capabilities. First, the dialog looks different (Figure 31).

Figure 31. The SYS(1037) dialog in VFP 9 (right image) has a more modern interface than its VFP 8 counterpart (left image).
Second, it now has a return value indicating whether the user
pressed OK (“1”) or
Cancel (“0”).
The biggest change, though, is that you can pass it a parameter to tell it what to do. Passing 0 or no parameter displays the default Page Setup dialog. To display and possibly change the Page Setup settings for a particular report, open the report as a table (that is, USE MyReport.FRX), and then call SYS(1037, 1). You can save and restore the current default printer settings using SYS(1037, 2) (which writes the default printer settings to an FRX opened as a table in the current workarea) and SYS(1037, 3) (which sets the default printer settings to those in a FRX open in the current workarea); neither of these displays the Page Setup dialog. This is typically used to push and pop printer settings.
![]()
SYS1037.PRG, included in the Developer Download files for this chapter (www.hentzenwerke.com), demonstrates how SYS(1037, 2) and SYS(1037, 3) can save and restore the default printer settings.
APRINTERS() can now accept a new optional argument of 1, in which case the resulting array has three new columns showing the driver, comment, and location.
Like the SYS(1037) dialog, the Print dialog displayed when you use the PROMPT keyword in the REPORT command has a more modern appearance (Figure 32).

Figure 32. The dialog displayed with the PROMPT clause of the REPORT command has a more modern interface in VFP 9 (right image) than in VFP 8 (left image).
Summary
VFP 9 has an incredible number of changes in the reporting engine. These changes make it easier to work with the Report Designer, make it possible to create types of reports you either couldn’t do before or were hard to do, and provide new types of output. In addition, the VFP team provided the hooks necessary to extend the capabilities of the reporting engine in both design-time and run-time environments; we will examine these in detail in the next two chapters. You can expect a lot of new uses for VFP reporting, and many new discoveries about what its capabilities are in the years to come.
Updates and corrections for this chapter can be found on Hentzenwerke’s website, www.hentzenwerke.com. Click “Catalog” and navigate to the page for this book.